Sisense widget script: Dynamic color coding indicator widget
- Lekha Mirjankar

- May 14, 2022
- 2 min read
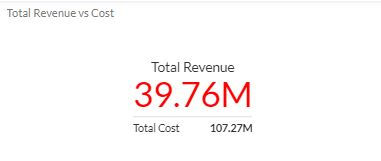
In this tutorial, we'll explore how to implement Sisense widget script for dynamic color coding in indicator widgets. This feature allows you to change the color of the indicator based on certain conditions applied on another measure, making your dashboard more visually informative.
In the built-in color coding feature, we have the option to set threshold based on primary and secondary values only. In case, we use the formula option to specify the conditions; it interferes with the backend query and the widget might give wrong results (this has happened with me few times).
To avoid all those issues, we are going to utilize a much efficient approach which checks the conditions only after after the result is calculated and makes changes to the UI.
Step 1: Adding the widget script
Begin by opening your Sisense dashboard in the Edit mode. Locate the indicator widget for which you want to implement color coding. Add the following code into the widget's script editor.
widget.on('processresult', function(widget, query) {

    // when result < -5 then 'red'

    if(((query.result.value.data/query.result.secondary.data)-1) <  -0.05)
    {
        query.result.gauge.color = '#ff0000'
    }

    // when result < 0 then 'yellow'

    else if(((query.result.value.data/query.result.secondary.data)-1) < 0)
    {
        query.result.gauge.color = '#FAD02C'
    }

    // when result >= 0 then 'green'

    else if(((query.result.value.data/query.result.secondary.data)-1) >=0)
    {
        query.result.gauge.color = '#00a808'
    }

    // default color : 'orange'

    else
    {
        query.result.gauge.color = '#ff7e20'
    }

});
Step 2: Understanding the Code Logic
We use the `widget.on('processresult', function(widget, query) {...})` event handler to execute our code when the widget's results are processed.
You can use the primary and secondary value result to perform any kind of calculation and use that as color coding condition.
Primary Value: query.result.value.data
Secondary Value: query.result.secondary.data
The code divides the primary data value by the secondary data value and subtracts 1.
e.g. Variance = (Actual/Target)-1
Depending on the calculated result, the color is set accordingly. If the result is less than -0.05, the color is set to red; if it's less than 0, the color is set to yellow; and if it's greater than or equal to 0, the color is set to green. A default color of orange is set for other cases.
Step 3: Applying the Changes
After adding the script, click "Save" to apply the changes and refresh the widget. Now, your indicator widget's color will dynamically update based on the result calculated from your data.

This feature adds a layer of interactivity and visual clarity to your dashboard, allowing viewers to quickly assess the data's significance. Experiment with different thresholds conditions and colors to customize the visualization according to your requirements.
GitHub link : https://github.com/lekhamirjankar/Sisense-scripts


Comments